Tegola With OpenLayers
An open source mapping solution for web and mobile
Introduction
Tegola is a vector tile server written in Go. Tegola takes geospatial data from a PostGIS Database and slices it into vector tiles that can be efficiently delivered to any client.
OpenLayers is a client library for rendering MVT and raster maps. Combined with Tegola, developers may now render maps on the web or on mobile utilizing all open source technology.
This guide will take you through the steps to get Tegola rendering a map using OpenLayers and visualized in a web browser.
Getting Started
The first thing you’ll need is a Tegola endpoint. You can either set up one locally by following the instructions located in the Tegola docs or you can use an existing endpoint.
For the following example we’ll be pulling in data from a Tegola instance hosted at https://tegola-osm-demo.go-spatial.org.
Set up the HTML
Next, we make an HTML page that will show the map. The following is a minimal example HTML page for rendering a map with OpenLayers. Copy and paste the following code into an empty file and name it index.html.
<!DOCTYPE html>
<html lang="en">
  <head>
    <script src="https://cdn.jsdelivr.net/npm/ol@v7.1.0/dist/ol.js"></script>
    <link
      rel="stylesheet"
      href="https://cdn.jsdelivr.net/npm/ol@v7.1.0/ol.css"
    />
    <style>
      #map {
        height: 600px;
        width: 100%;
      }
    </style>
    <title>OpenLayers example</title>
  </head>
  <body>
    <div id="map"></div>
    <script type="text/javascript">
      var map = new ol.Map({
        target: "map",
        layers: [
          new ol.layer.VectorTile({
            source: new ol.source.VectorTile({
              format: new ol.format.MVT(),
              url: "https://tegola-osm-demo.go-spatial.org/maps/osm/{z}/{x}/{y}.pbf",
            }),
          }),
        ],
        view: new ol.View({
          //coordinates the map will center on initially
          center: ol.proj.fromLonLat([-117.15, 32.72]),
          zoom: 14,
        }),
      });
    </script>
  </body>
</html>
We are including the OpenLayers library from in the head of the document.
In the body, we define <div id="map"></div> which is the container that will
hold the rendered map.
To render the map we will use a JavaScript snippet that creates a new
instance of ol.Map.
var map = new ol.Map({
  target: "map",
  layers: [
    new ol.layer.VectorTile({
      source: new ol.source.VectorTile({
        format: new ol.format.MVT(),
        url: "https://tegola-osm-demo.go-spatial.org/maps/osm/{z}/{x}/{y}.pbf",
      }),
    }),
  ],
  view: new ol.View({
    //coordinates the map will center on initially
    center: ol.proj.fromLonLat([-117.15, 32.72]),
    zoom: 14,
  }),
});
Important details to note in this snippet are the target:'map' piece which
tells OpenLayers to instantiate the map into the div with an id of map.
The layers array are where the sources for geospatial data are defined.
For Tegola, we’ll be using the VectorTile source which is of type MVT.
The URL inside the source is the endpoint which will be queried to get the data.
In this case we are using a Tegola endpoint which serves up OpenStreetMap (OSM) data.
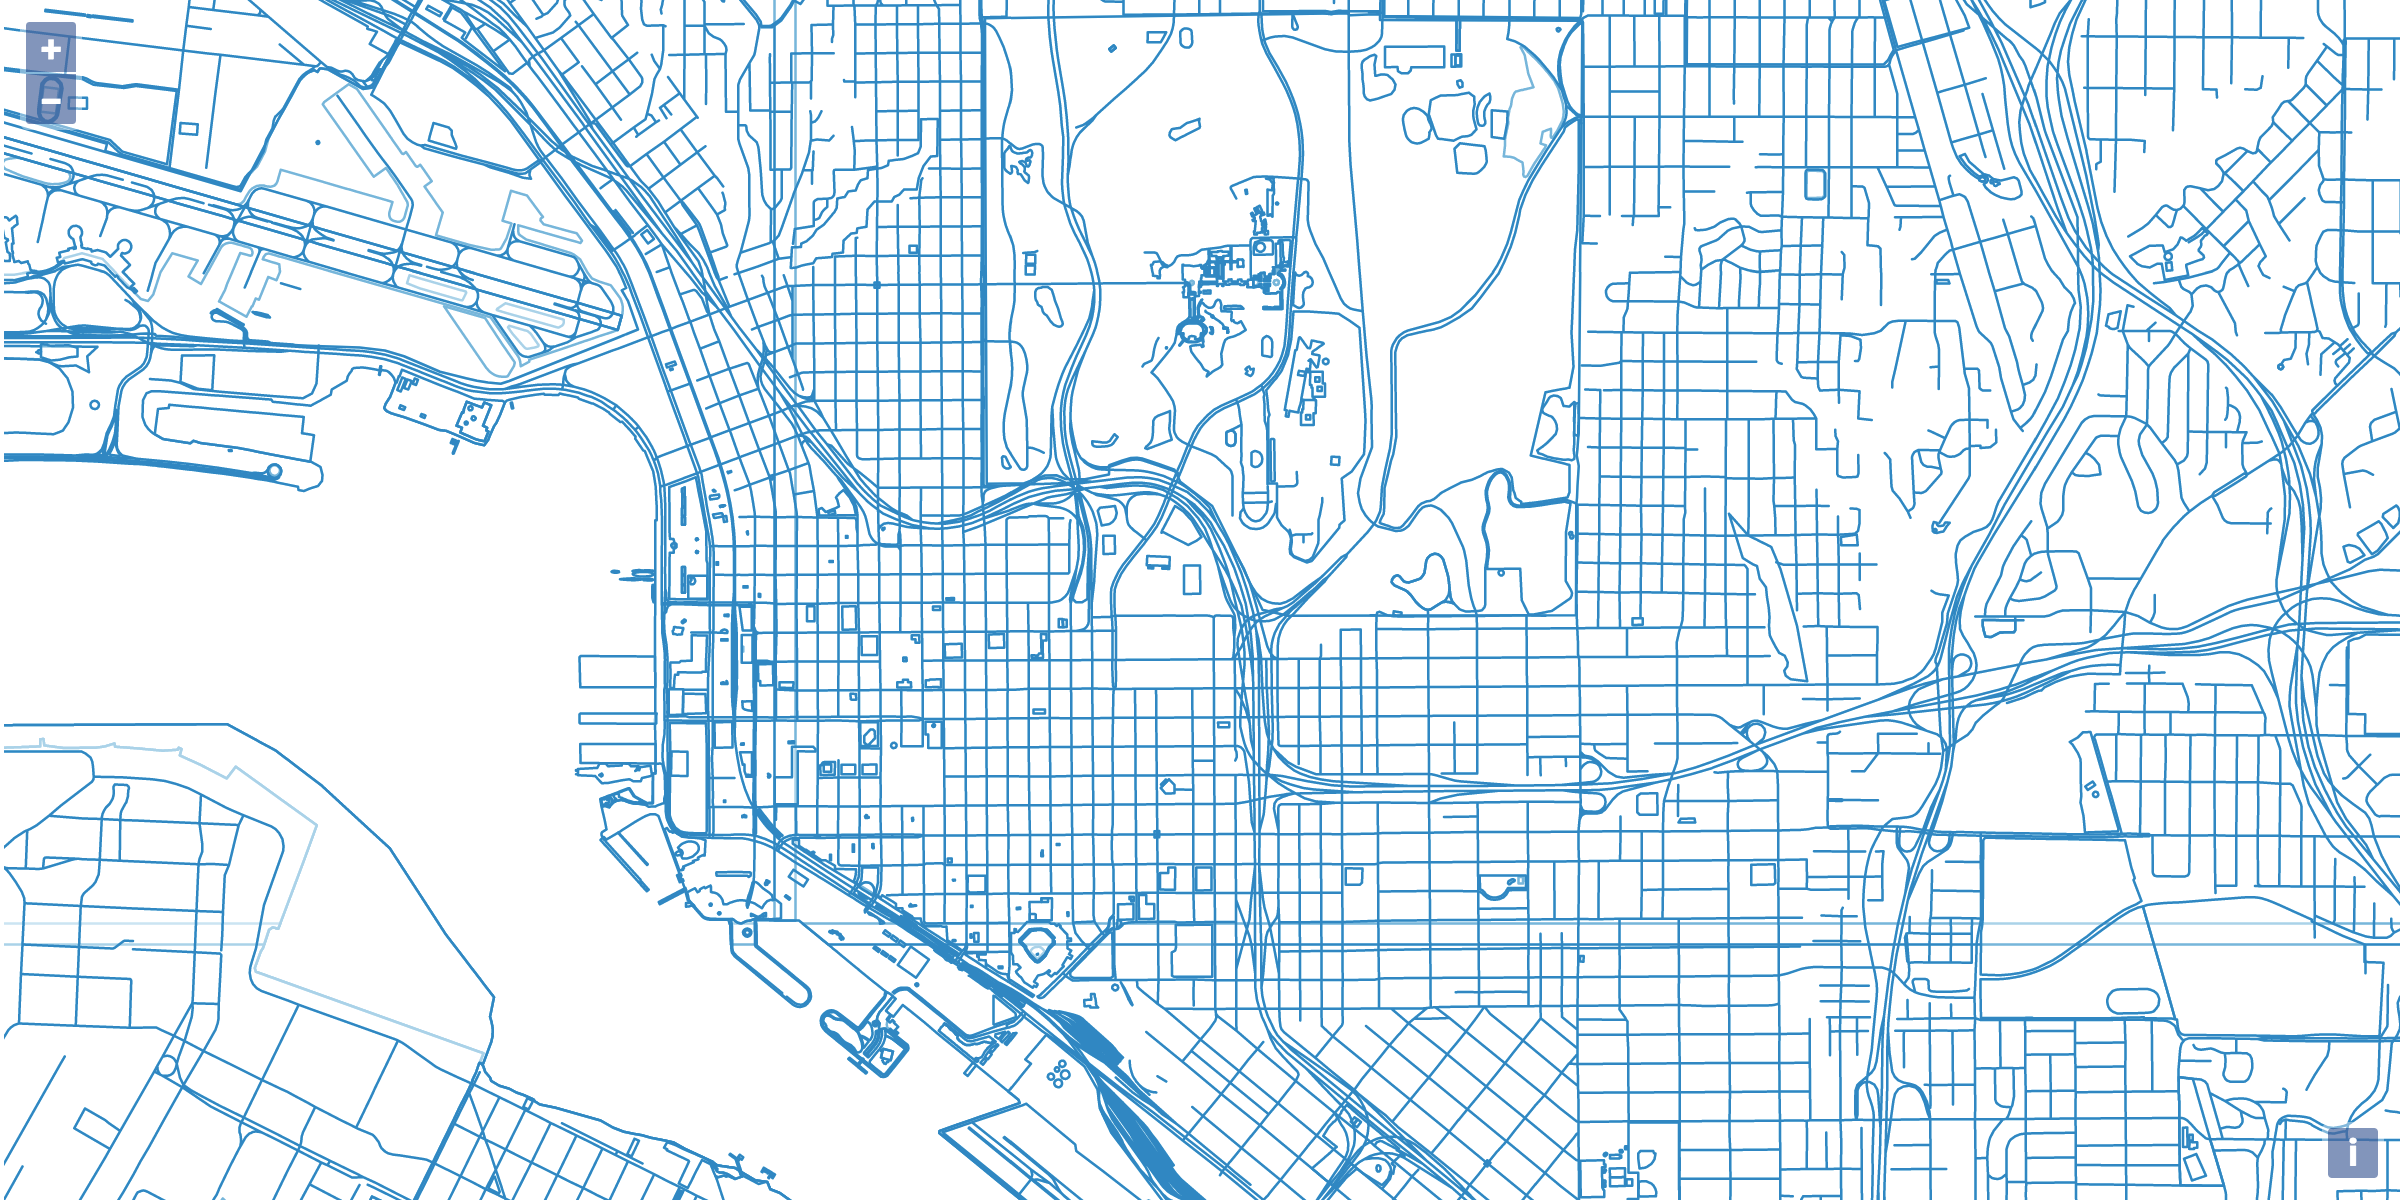
Open the HTML file in a browser and you should see the following:

A map of San Diego, CA rendered with the default styles provided by the Open Layer’s library. Next, let’s add some custom styles to your new map.
Styling the Map
To style the map we’ll need to define a JavaScript function to apply fills and borders to the various features of our map. Let’s start by applying a default style to every feature on the map.
OpenLayers applies map styling by utilizing a style function. Every feature in a given map layer will call the style function. The style function then returns an array of styles to apply to the given feature.
var defaultStyle = new ol.style.Style({
  fill: new ol.style.Fill({
    color: [234, 231, 221, 1],
  }),
  stroke: new ol.style.Stroke({
    color: [182, 177, 162, 1],
    width: 1,
  }),
});

// the styleFunction will define how our features on the map get styled
function styleFunction(feature, resolution) {
  console.log("feature:", feature);
  return [defaultStyle];
}

var map = new ol.Map({
  target: "map",
  layers: [
    new ol.layer.VectorTile({
      source: new ol.source.VectorTile({
        format: new ol.format.MVT(),
        url: "https://tegola-osm-demo.go-spatial.org/maps/osm/{z}/{x}/{y}.pbf",
      }),
      // here we apply the styleFunction to the layer
      style: styleFunction,
    }),
  ],
  view: new ol.View({
    //coordinates the map will center on initially
    center: ol.proj.fromLonLat([-117.15, 32.72]),
    zoom: 14,
  }),
});
Copy and paste the above code into the script tag of the HTML document defined above.
Here we’re defining styleFunction which will take over responsibility for
styling the features of the map. In this case we’re setting a default style to
be used on all map features. The map should now render in two shades of beige.
Next, we’ll be selecting features to give custom styles to.
Defining Feature Styles
Now we can start to pick out the features we’d like to apply custom styles to.
Inside the styleFunction we can determine different features based on their
attributes. The attributes we’ll be using in the following example are type
and layer.
OpenLayers allows you to reference attributes using the feature.get() function.
The following snippet shows a console log example of this usage.
function styleFunction(feature, resolution){
    console.log('feature type:',feature.get('type'),'layer:',feature.get('layer'));
});
By including a console log into the style function, the feature attributes will be logged out to the console. This will give you an idea of which features are available for styling.
Once the features have been identified, we’re ready to start giving them some style. Now we can define the feature specific styles.
var waterStyle = new ol.style.Style({
  fill: new ol.style.Fill({
    color: [28, 121, 181, 1],
  }),
  stroke: new ol.style.Stroke({
    color: [27, 107, 159, 1],
    width: 1,
  }),
});

var streetStyle = new ol.style.Style({
  fill: new ol.style.Fill({
    color: [111, 44, 173, 1],
  }),
  stroke: new ol.style.Stroke({
    color: [93, 32, 150, 1],
    width: 1,
  }),
});
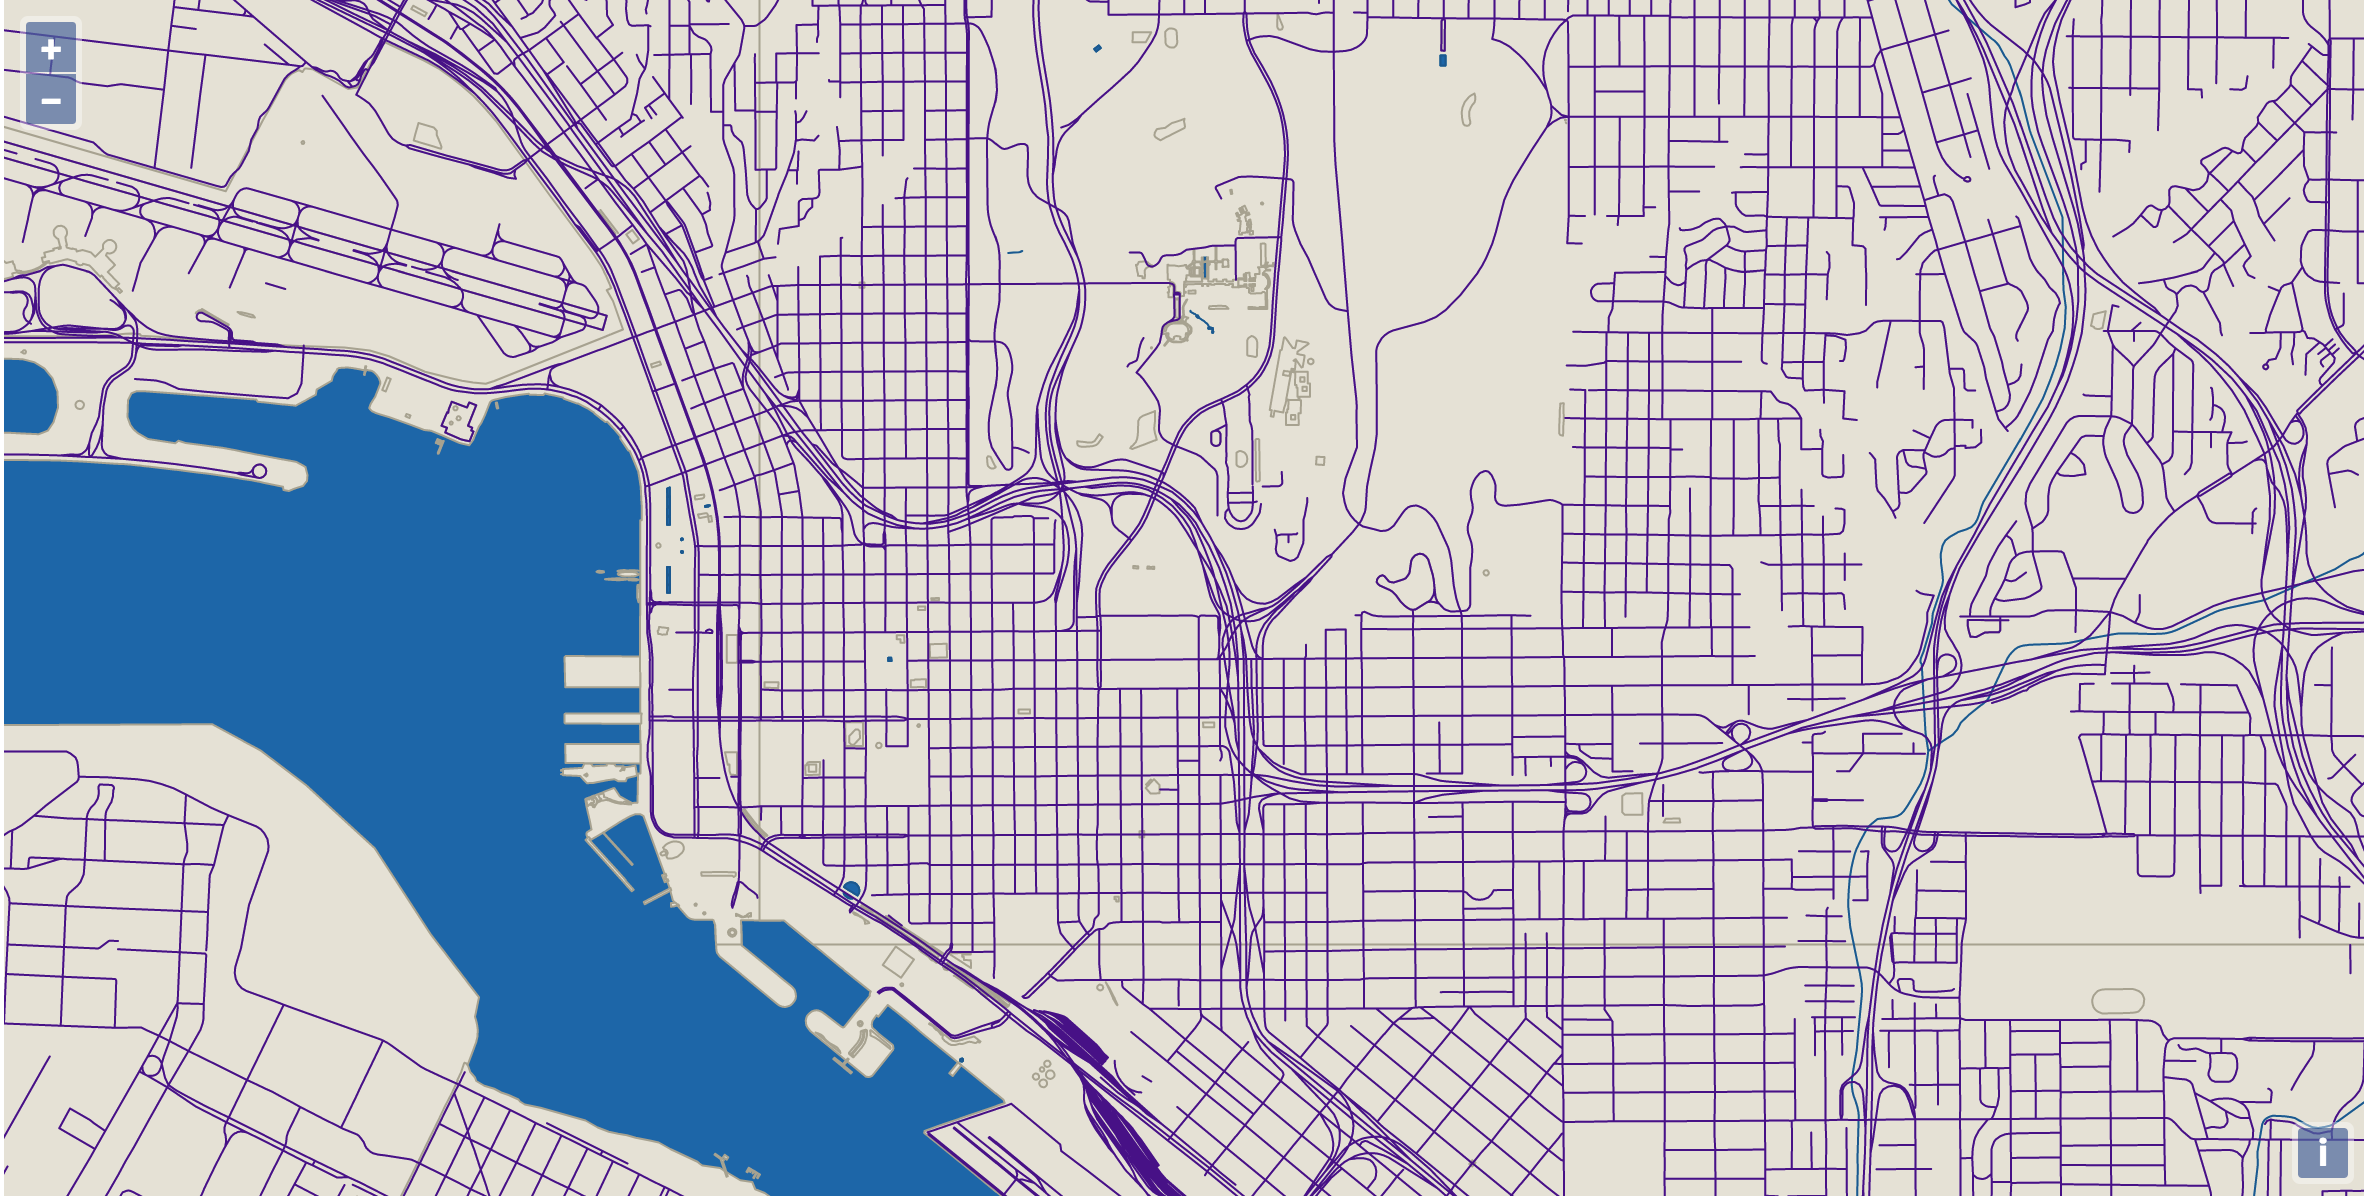
Here we define two styles — a deep blue for the water features and a violet
for streets. Next we can apply these styles to specific features with if
statements inside styleFunction.
function styleFunction(feature, resolution) {
  if (
    feature.get("type") == "water" ||
    feature.get("layer") == "water_areas" ||
    feature.get("layer") == "water_lines"
  ) {
    return [waterStyle];
  }
  if (feature.get("layer") == "transport_lines") {
    return [streetStyle];
  }
  if (
    feature.get("layer") == "country_polygons" ||
    feature.get("layer") == "landuse_areas"
  ) {
    return null; // return null for no style to be applied
  }
  return [defaultStyle];
}
Finally, the oceans are generally not defined as features inside the data sources.
To give the oceans a color, let’s give our div a background-color.
#map {
  height: 600px;
  width: 100%;
  background-color: #1c79b5;
}
All Together
The following is the full HTML file with custom styling for water and streets.
<!DOCTYPE html>
<html lang="en">
  <head>
    <script src="https://cdn.jsdelivr.net/npm/ol@v7.1.0/dist/ol.js"></script>
    <link
      rel="stylesheet"
      href="https://cdn.jsdelivr.net/npm/ol@v7.1.0/ol.css"
    />
    <style>
      #map {
        height: 600px;
        width: 100%;
        background-color: #1c79b5;
      }
    </style>
    <title>OpenLayers example</title>
  </head>
  <body>
    <div id="map" class="map"></div>
    <script type="text/javascript">
      var defaultStyle = new ol.style.Style({
        fill: new ol.style.Fill({
          color: [234, 231, 221, 1],
        }),
        stroke: new ol.style.Stroke({
          color: [182, 177, 162, 1],
          width: 1,
        }),
      });

      var waterStyle = new ol.style.Style({
        fill: new ol.style.Fill({
          color: [28, 121, 181, 1],
        }),
        stroke: new ol.style.Stroke({
          color: [27, 107, 159, 1],
          width: 1,
        }),
      });

      var streetStyle = new ol.style.Style({
        fill: new ol.style.Fill({
          color: [111, 44, 173, 1],
        }),
        stroke: new ol.style.Stroke({
          color: [93, 32, 150, 1],
          width: 1,
        }),
      });

      function styleFunction(feature, resolution) {
        if (
          feature.get("type") == "water" ||
          feature.get("layer") == "water_areas" ||
          feature.get("layer") == "water_lines"
        ) {
          return [waterStyle];
        }
        if (feature.get("layer") == "transport_lines") {
          return [streetStyle];
        }
        if (
          feature.get("layer") == "country_polygons" ||
          feature.get("layer") == "landuse_areas"
        ) {
          return null; // return null for no style to be applied
        }
        return [defaultStyle];
      }

      var map = new ol.Map({
        target: "map",
        layers: [
          new ol.layer.VectorTile({
            source: new ol.source.VectorTile({
              format: new ol.format.MVT(),
              url: "https://tegola-osm-demo.go-spatial.org/maps/osm/{z}/{x}/{y}.pbf",
            }),
            style: styleFunction,
          }),
        ],
        view: new ol.View({
          //coordinates the map will center on initially
          center: ol.proj.fromLonLat([-117.15, 32.72]),
          zoom: 14,
        }),
      });
    </script>
  </body>
</html>
And here’s what you should see when you open up a browser:

For more information on styling OpenLayers maps check out the official documentation: styling vector layers.